NMAP 7.80 on Cent7 Linux hangs during "discovery" phase with ping on large networks #2153
Comments
|
Update. I ran several more tests with different levels. I have three CENT 7 based systems I am running tests. I have seen the issue come up on very sparse networks ( in fact possibly nothing to respond ) only. Two of the CENT7 systems are "appliances" based on cent7 that I have root access into that are my companies product. These are patched and hardened. They work fine on non-sparse larger ( /20 + ) networks but not on sparse/empty ones. The third is a "client" on a test network ( same as the two appliances ). I have been able to get this to complete once but generally have the same hangs. Last night i left this running for 12 hours over night. I also was running a TCPDUMP on one of the systems. What I saw was interesting - lots of activity until it would just stop. It would stop for some time then start again - I never made it out of "discovery" phase. The scan was against a /20 network from the same LAN but across some routing devices. What is interesting is every time I see a pause the last traffic is a HTTPS call to an ip as part of the discovery. The ICMP calls just seem to repeat and repeat and repeat. I can repeat this on several /20 networks that have the same trait of being sparse. I have others that are populated that I complete just fine. I am unsure if there is something on my network causing this - and am following up with my network team but I cannot see what would cause this behavior in NMAP. My next steps are to see what a Windows server base ( another possibility if not using appliance for my companies product ) does and if it behaves the same. I also have captured only to the screen but will start capturing PCAP data on my next round of tests overnight tonight that I can share but not in a public github issue ( direct email ) due to security concerns |
|
I started this running about 3 hours ago. My linux has hung on PING SCAN, on the windows I did not notice but i did the -Pn flag so it is also stuck but on SYN Stealth Scan - however both are hung and not completing. My wireshark on the windows shows it is not even doing scanning any longer. I may re-run this over night after a few hours of data collected today I checked with my network support and the networks im testing should not have any clients. I would not think this to be an issue but but it is strange. Additionally I see on port 80 some of these devices are sending resets - not "black hole-ing" teh traffic. This is due to network gateway devices set to do so - even though nothing is there we will get the reset. I have also broken one of my /20 networks into its component 16 /24's. I ran scans successfully on all of the /24's all of which show some data but it is all related to RESETs. I really feel something in the size of no responding is a key here. I am going to update to 7.9 likely tomorrow to test if this is a bug that was fixed but I fear it will be an issue still. |
|
Thanks for all this detailed information. For "hung" scans where status messages are still being delivered, the most useful output is the detailed timing information available at debug level 4. You can get this by running with |
|
Awesome
I just kicked off another run with the parameters you requested
[image: image.png]
I am running a wireshark on the windows run and tcpdump on the linux one
and outputting a redirect to file. I am going to let these run until
morning and then break it and pull the data in a zip and send it
Thanks!
Jason Moras - Global Lead SME : Discover
Email : jason.moras@tanium.com
Phone : 248-414-6125
Join Tanium Community
<https://community.tanium.com/CommunitiesSelfReg?startURL=/s/discover-central?t=1595339289292>
| Discover Central <https://community.tanium.com/s/discover-central> |
Unsubscribe <https://site.tanium.com/manage-preferences.html>
…On Thu, Oct 15, 2020 at 6:57 PM Daniel Miller ***@***.***> wrote:
Thanks for all this detailed information. For "hung" scans where status
messages are still being delivered, the most useful output is the detailed
timing information available at debug level 4. You can get this by running
with -d4, but for such a large scan you will end up with a *TON* of
output. If you are running interactively (i.e. in a terminal window and not
in a command pipeline), you could instead wait for the hang to evidence and
then press d 4 times. If you *can* run the entire scan with -d4, you can
zip/tar/compress the output and email it to ***@***.*** where it
will be handled with confidentiality. I think that the entire set of
options needed to reproduce would probably be -sn -n -d4, but if you have
any extra -P* options, you'd need to include those as well.
—
You are receiving this because you authored the thread.
Reply to this email directly, view it on GitHub
<https://urldefense.com/v3/__https://github.com/nmap/nmap/issues/2153*issuecomment-709632553__;Iw!!KRkdd9U!rfDOOsoEa-iji7qRS4cEMjYr0FZs_llmvdNDyApZN-aWFJ9VlJrh0d_zxtT0AgI6$>,
or unsubscribe
<https://urldefense.com/v3/__https://github.com/notifications/unsubscribe-auth/ADKN5BOQ3DRRHUAFV674K23SK545JANCNFSM4SQ4UBPA__;!!KRkdd9U!rfDOOsoEa-iji7qRS4cEMjYr0FZs_llmvdNDyApZN-aWFJ9VlJrh0d_zxhj0ULMI$>
.
|
|
Linux is collecting data. Windows I am not sure - but should be enough -
windows has already stopped responding based on wireshark - im still
watching data fly on linux but as I said - i will let run all night then
jump on to collect...of course im assuming it wont work based on my
experience so far but likely i can recreate this again ( its been easy to )
Thanks!
Jason Moras - Global Lead SME : Discover
Email : jason.moras@tanium.com
Phone : 248-414-6125
Join Tanium Community
<https://community.tanium.com/CommunitiesSelfReg?startURL=/s/discover-central?t=1595339289292>
| Discover Central <https://community.tanium.com/s/discover-central> |
Unsubscribe <https://site.tanium.com/manage-preferences.html>
…On Thu, Oct 15, 2020 at 8:56 PM Jason Moras ***@***.***> wrote:
Awesome
I just kicked off another run with the parameters you requested
[image: image.png]
I am running a wireshark on the windows run and tcpdump on the linux one
and outputting a redirect to file. I am going to let these run until
morning and then break it and pull the data in a zip and send it
Thanks!
Jason Moras - Global Lead SME : Discover
Email : ***@***.***
Phone : 248-414-6125
Join Tanium Community
<https://community.tanium.com/CommunitiesSelfReg?startURL=/s/discover-central?t=1595339289292>
| Discover Central <https://community.tanium.com/s/discover-central> |
Unsubscribe <https://site.tanium.com/manage-preferences.html>
On Thu, Oct 15, 2020 at 6:57 PM Daniel Miller ***@***.***>
wrote:
> Thanks for all this detailed information. For "hung" scans where status
> messages are still being delivered, the most useful output is the detailed
> timing information available at debug level 4. You can get this by running
> with -d4, but for such a large scan you will end up with a *TON* of
> output. If you are running interactively (i.e. in a terminal window and not
> in a command pipeline), you could instead wait for the hang to evidence and
> then press d 4 times. If you *can* run the entire scan with -d4, you can
> zip/tar/compress the output and email it to ***@***.*** where it
> will be handled with confidentiality. I think that the entire set of
> options needed to reproduce would probably be -sn -n -d4, but if you
> have any extra -P* options, you'd need to include those as well.
>
> —
> You are receiving this because you authored the thread.
> Reply to this email directly, view it on GitHub
> <https://urldefense.com/v3/__https://github.com/nmap/nmap/issues/2153*issuecomment-709632553__;Iw!!KRkdd9U!rfDOOsoEa-iji7qRS4cEMjYr0FZs_llmvdNDyApZN-aWFJ9VlJrh0d_zxtT0AgI6$>,
> or unsubscribe
> <https://urldefense.com/v3/__https://github.com/notifications/unsubscribe-auth/ADKN5BOQ3DRRHUAFV674K23SK545JANCNFSM4SQ4UBPA__;!!KRkdd9U!rfDOOsoEa-iji7qRS4cEMjYr0FZs_llmvdNDyApZN-aWFJ9VlJrh0d_zxhj0ULMI$>
> .
>
|
|
Maybe related to #1922 ? |
We attempted to fix this twice already, so this change reverses r36709
(which simply ignored all Time Exceeded messages for host discovery,
leading to long scan times when the TTL is insufficient) and r34557
(which used incorrect logic to match ICMP responses, resulting in
ignoring all ICMP error messages in response to ICMP probes, e.g. Time
Exceeded for Echo Request).

Instead, we'll correctly verify that the ICMP ID of the *encapsulated
datagram* matches the one for the probe we are attempting to match.
|
@cnotin Yes, this has the same behavior. Thanks for reminding me! |
|
The debug output has plenty of "Moving X to completed hosts list with 0 outstanding probes" messages, but every time the number of per-target active probes drops without a corresponding drop in Groupstats active probes, there is exactly that number of lines that say "Moving Y to completed hosts list with 1 outstanding probe." This has to be where the "missing probes" are going. |
|
If that helps my scans are also very sparse: scanning a /8 with thousands machines in total but distributed in subnets, and especially since I use a prior randomized input file. |
|
Ok, this was a perfect storm of a bunch of different stuff, and we're going to make things better from here on:
We'll see if the users reporting these issues can test with these fixes. I'd like to get a positive response before I close these issues and put a changelog entry in. |
|
Looks good to me! Thanks |
|
I'm starting to see similar issues as described above, specifically with host scans taking place on an empty subnet. Currently running the below system: Replicated issue on nmap version 7.8 + upgrade to nmap version 7.91 (using alien to alter .rpm to .deb) I attached the d4 debug log and noticed that sending rates continuously decreasing starting on line 14611 until ultimately hitting 0. The command I ran was the below:
With an active subnet, the above scan would be less than a minute on a /24. In this case, Groupstats showed that 44/256 were incomplete. I think the closest I got was 4 before sending packets went to 0. Any workarounds would be appreciated :). **SOLVED: I wonder if this has something to do with how many hops it takes? I moved the machine to our /16 network which had plenty of empty /24s, and no issues. ** |
|
Fixed in Nmap 7.92. |
Describe the bug
I am testing against multiple sparse /20 networks. Some of these have no clients on them ( known ) but I am probing to verify. Initially i have this set with -v0 so I have no output in my scripts and i am exporting to XML file which all it shows is the header of the XML response.
I turned on -v4 and -d flags - debug gave little but -v4 added items to the output XML file.
The above shows the start of the task then the end of the file. I see it move forward for quite a while then just stop. it will hang at the 97 or 98 % marker until I either kill it or my background process kills child tasks. The XML file never progresses and it indicates to me most likely this hung but I have no idea why.
As a note - if I do disabling of ping using -Pn I often see something similar but in the Syn Stealth Scan
I can also recreate this manually and run the flags interactively. When I do i see the output to the screen showing no better data here other than the hangs.

I can see this on multiple sparse networks. This is over a local LAN link across a router or two OR across my WAN links ( same on both ). I can easily see some work and some dont - all are defined as /20 networks
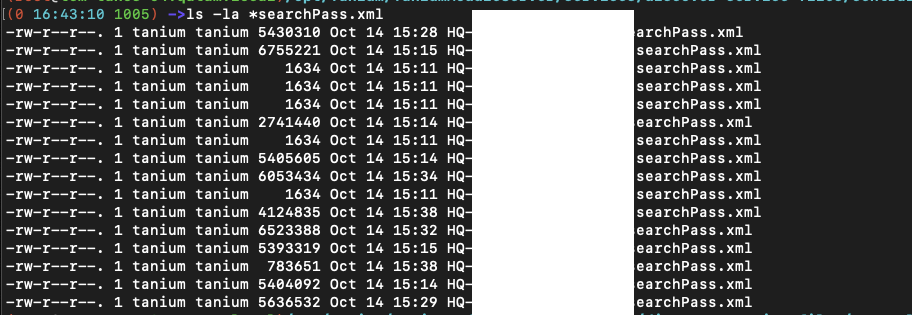
In the below image ( removed network ips ) you can see the files that are 1634 in size show only the header and run for some time exhibiting the above behavior. The larger files are running normally
To Reproduce
I have a customer ( we are an OEM license for insecure ) who reported this, but I have recreated it in my lab. The key is running against a larger ( /21 or /20 network ) and it being very sparse ( possibly no responses ). I am unsure WHY though and am suspecting there may be something on my network being returned that causes an issue - but the networks that i see it on are very sparse. This is similar for my end-customer who reported it.
Expected behavior
Scan completes - XML file is closed with correct items, nmap process exits normally
Version info (please complete the following information):
nmap --version:Nmap version 7.80 ( https://nmap.org )
Platform: x86_64-unknown-linux-gnu
Compiled with: nmap-liblua-5.3.5 openssl-1.0.2p libz-1.2.11 libpcre-8.41 nmap-libpcap-1.9.0 nmap-libdnet-1.12 ipv6
Compiled without: libssh2
Available nsock engines: epoll poll select
nmap --iflistStarting Nmap 7.80 ( https://nmap.org ) at 2020-10-14 17:17 UTC
INTERFACES
DEV (SHORT) IP/MASK TYPE UP MTU MAC
eth0 (eth0) xx.xx.xx.xx/20 ethernet up 1500 FA:16:3E:90:3D:F7
eth0 (eth0) fe80::f816:3eff:fe90:3df7/64 ethernet up 1500 FA:16:3E:90:3D:F7
lo (lo) 127.0.0.1/8 loopback up 65536
lo (lo) ::1/128 loopback up 65536
ROUTES
DST/MASK DEV METRIC GATEWAY
xx.xx.xx/20 eth0 0
0.0.0.0/0 eth0 0 xx.xx.xx.xx
::1/128 lo 0
fe80::f816:3eff:fe90:3df7/128 lo 0
fe80::/64 eth0 256
ff00::/8 eth0 256
Additional context
Nothing special here. I originally saw this issue and figured it was just taking a long time. I have spent the last few days digging in. I can generate any other output files but would prefer to not attach internal ip addresses to GITHUB publicly avail to anyone.
I have reduced my testbed to only the LOCAL network ( all inside of one building ) and still see the same issues.
The text was updated successfully, but these errors were encountered: